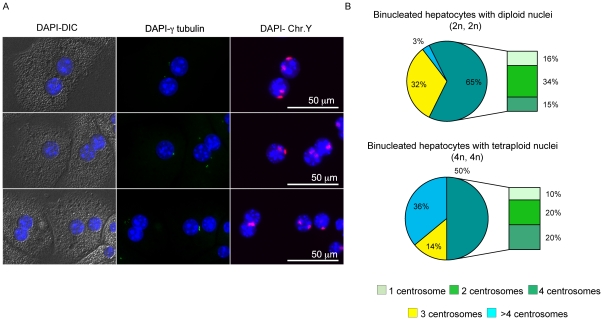
Figure 4. Analysis of centrosomes in relation to the DNA content.
Panel (A) Examples of hepatocytes analyzed by combined FISH (chromosome Y red) and immunofluorescence for γ-tubulin (green). A binucleated hepatocyte with two tetraploid nuclei as detected by copies of the Y chromosome carries only three centrosomes (top). A tetraploid mononucleated cell with one centrosome (abnormal condition) is shown in the middle panel together with a binucleated tetraploid cell with 4 centrosomes. We note that the centrosomes are positioned asymmetrically. A binucleated hepatocyte with six centrosomes is shown in the bottom panel. (B) The top pie summarizes the percentage of binucleated hepatocytes with both diploid nuclei showing the distribution of centrosomes (1, 2, 3, 4 and >4); on the bottom the centrosome distribution is plotted for binucleated cells with tetraploid nuclei.

