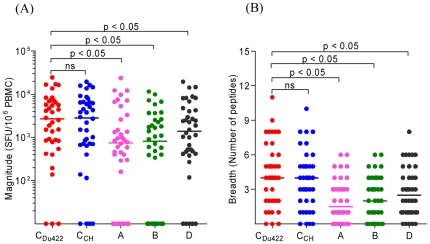
Figure 2. Recognition of HIV-1 Gag peptides from clades A, B, CDu422, CCH and D sequences in HIV-1 clade C infected individuals from South Africa.
(A) Total magnitude of Gag-specific T-cells (SFU/106 PBMC) against individual peptides for each study individual. Values are shown in log scale. (B) The minimum number of responses per peptide set for each study individual. Data is based on the p17p24p2 region of the Gag protein. Significant differences were tested for using one way ANOVA followed by a Dunn's post-test.

