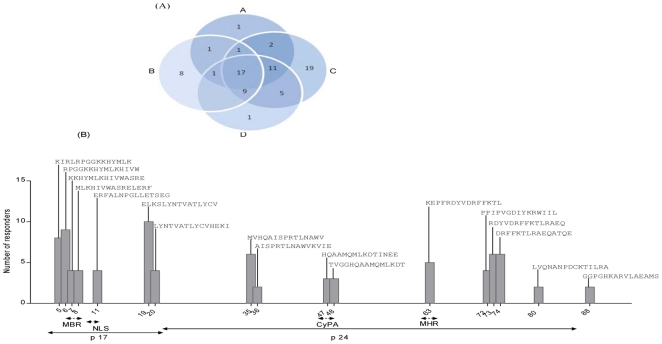
Figure 3. Characterisation of HIV-1-specific T-cells recognizing the five peptides sets investigated in the study.
(A) The contribution of each peptide variant to the overall HIV-1-specific T-cell responses in the study. Shown in each subset of the Venn diagram is the number of peptides recognized in each and overlapping between the four HIV-1 clades. Reactive peptides from all study individuals were combined after removing overlapping peptides. Each peptide was exclusively assigned to a recognition category depending on the clade in which it was identified. If a peptide was recognized in more than one category, the category that gave the highest cross-reactivity was considered. The two clade C peptide sets (CDu422 and CCH) were combined. (B) HIV-1 Gag cross-reactive epitope hotspots. The Gag region in which the peptides are located is shown, MBR: membrane binding region; NLS: nuclear localization signal; CyPA: Cyclophilin A binding region; and MHR: major homology region.

