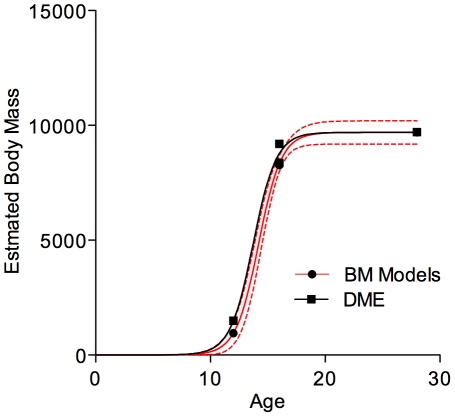
Figure 6. Adjusted growth curve (mass in kg as a function of age in years) for Tyrannosaurus rex.
Filled circles represent our mass estimates derived from digital modelling; squares represent data points generated using Developmental Mass Extrapolation [42]. The red line represents the best fit curve for modelled data; the black one is for the DME estimate. Stippled lines represent the 95% confidence intervals for the model-based estimates. The MOR specimen is treated as being 16 years old in this plot (see text).

