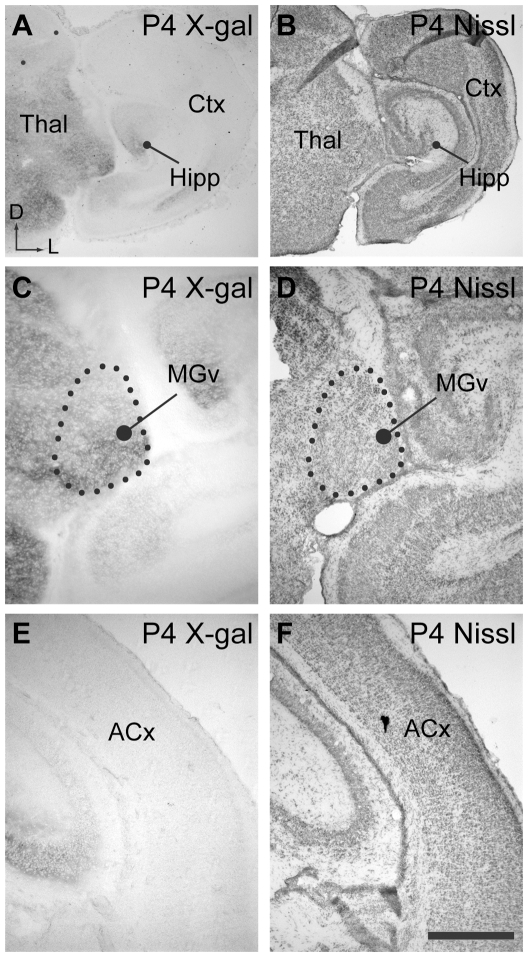
Figure 1. Expression of EphB2 in auditory pathways at P4.
A. Low power view of coronal P4 brain section from an EphB2lacZ/+ mouse showing X-gal histochemistry. Reaction product is abundant in the thalamus (Thal), and labeling is seen in the hippocampus (Hipp). Cortical regions (Ctx) show relatively little labeling. Axes: D, dorsal and L, lateral; applies to all panels. B. Section adjacent to that shown in A with Nissl staining to highlight brain regions. C. Higher power view of coronal section through thalamus in EphB2lacZ/+ mouse processed for X-gal histochemistry. Labeling is evident within the ventral medial geniculate nucleus (MGv). D. Nissl staining in section adjacent to that shown in A, used to identify thalamic regions. E. Coronal section showing region of auditory cortex (ACx), with minimal X-gal labeling. F. Adjacent section to that shown in C, with Nissl staining. Scale bar in F represents 500 µm for panels A−B and 200 µm for panels C−F.

