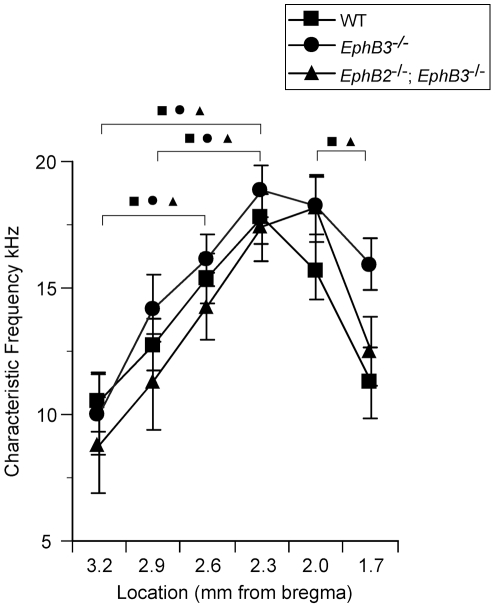
Figure 3. Tonotopic progression of CF is similar in mutant and wild type auditory cortex.
For all animals, CF was determined at recording sites separated by ∼300 µm along the anterior-posterior axis of cortex. Mean CF for each group is plotted according to position relative to bregma (all sites ∼6 mm lateral to midline). Symbols indicate significant differences (ANOVA with post-hoc paired t-tests, p<0.05) between recording sites within the same mouse strain, indicating topographic progression of CFs and reversal of topography between presumed A1 and the anterior auditory field.

