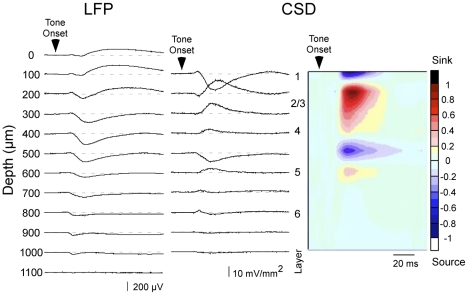
Figure 4. Laminar profile of CF tone-evoked responses in A1 of wild type mouse.
A representative example of LFPs (left column), derived one-dimensional CSD traces (middle) and interpolated color plot (right) shows the response to a CF stimulus. Responses shown are from the top 12 recording sites of a 16-channel silicon multiprobe, which span the entire cortical thickness; the most superficial site (labeled 0 µm) was visible at the cortical surface. Color scale indicates response amplitude normalized to the largest current sink (reds/black) and largest current source (blues/white), and also applies to all subsequent CSD figures.

