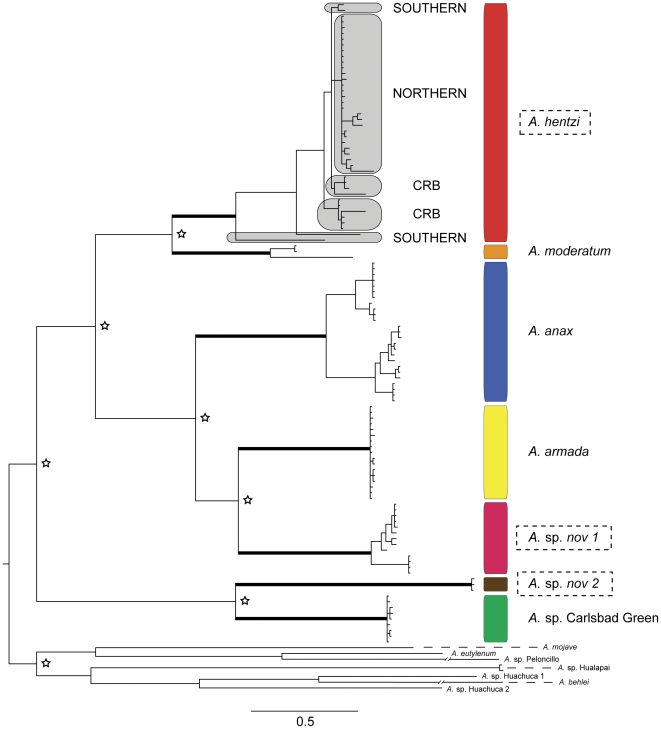
Figure 3. Inferred Bayesian mtDNA phylogeny for the Aphonopelma of Texas.
The key (inset) references the seven species delimited in this analysis by species name (Red = A. hentzi; Orange = A. moderatum; Blue = A. anax; Yellow = A. armada; Pink = A. sp. nov 1; Brown = A. sp. nov 2; Green = A. sp. Carlsbad Green). These colors and species combinations are consistent throughout the figures. A. hentzi population designations are highlighted by light grey boxes. Outlined boxes around species names denote members of the hentzi cryptic species group. A thickened branch denotes species clades with Bayesian posterior probabilities of 1.00 and ML bootstrap values ≥95%. Support for major nodes with Bayesian posterior probabilities of 1.00 and ML bootstrap values ≥95% are denoted by the star symbol. Western United States species comprise the outgroup.

