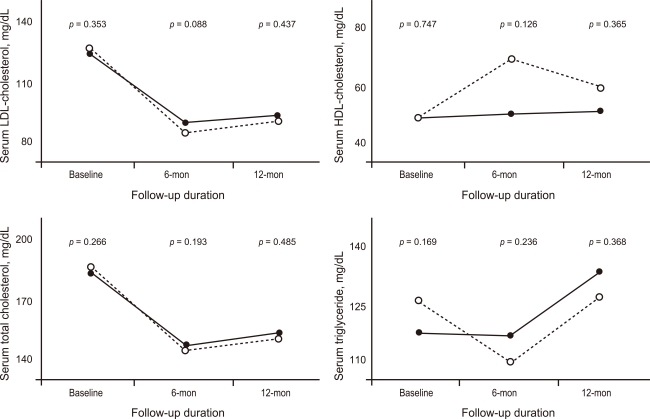
Figure 1.
Changes in the lipid panel at follow-up (solid line, lipophilic-statin group; dotted line, hydrophilic-statin group. p value represents the statistical difference between the lipid values of the hydrophilic- and lipophilic-statin groups). HDL, high-density lipoprotein; LDL, low-density lipoprotein.

