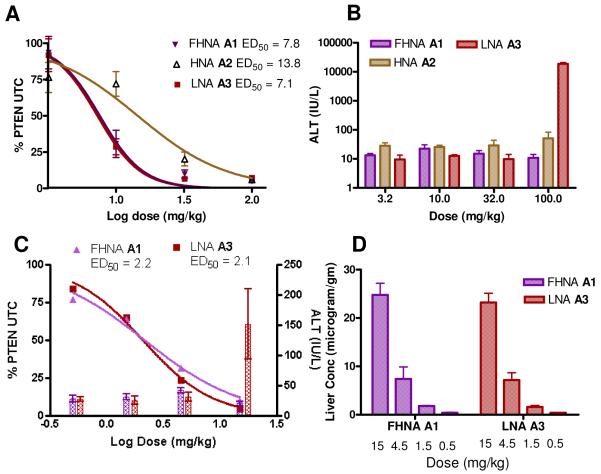
Figure 5.
Biological evaluation of of FHNA A1, HNA A2 and LNA A3 ASOs in mice (A) Mice (n = 4/dose group) were injected i.p. with a single dose of 3.2, 10, 32 and 100 mg/kg of ASO in saline and animals were sacrificed 72 hours after the last dose. Liver PTEN mRNA was measured using quantitive RT-PCR. (B) Plasma ALT levels after sacrifice. (C) Mice (n = 4/dose group) were injected i.p. twice a week for three weeks with 0.5, 1.5, 4.5 and 15 mg/kg of FHNA A1 and LNA A3 ASOs in saline and animals were sacrificed 72 hours after the last dose. Liver PTEN mRNA was measured using quantitative RT-PCR and plasma ALT levels were recorded post sacrifice. (D) Tissue levels of FHNA and LNA ASOs from 3-week study.

