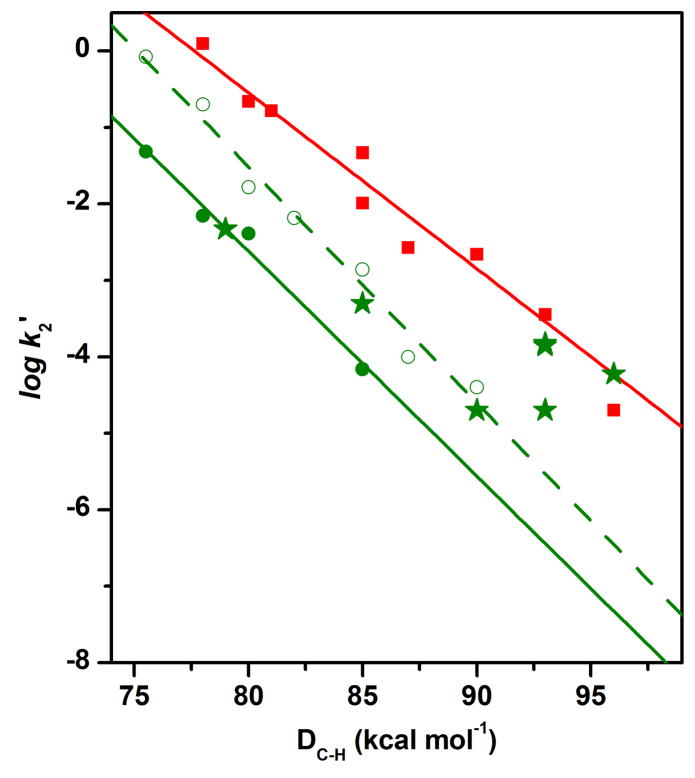
Figure 2.
The log k2′-vs-DC–H plots for reactions of 3 with all substrates (squares), 1 with hydrocarbon substrates (filled circles) or with alcohol substrates (stars) in the presence of 50 mM H2O, and 1 with hydrocarbon substrates (open circles) in the presence of 1.0 M H2O. The straight line for 3 was obtained by using the k2′ values of all substrates, while that for 1 was obtained by fitting only the k2′ values of hydrocarbon substrates. The k2′ values used for the plots and the reaction conditions are listed in Table S1.

