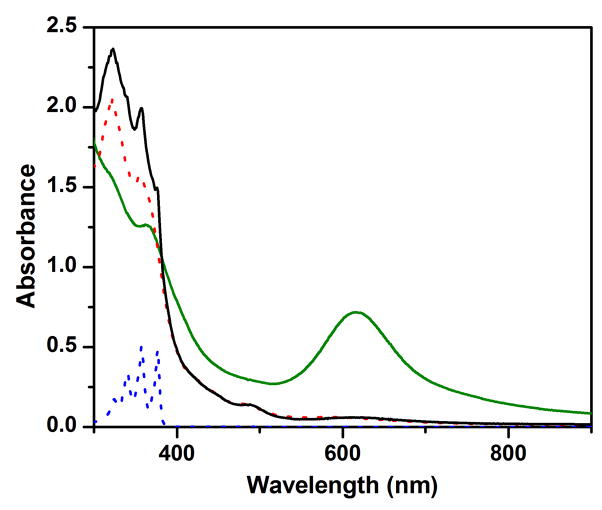
Figure 3.
The UV-vis spectra of 0.15 mM complex 1 in MeCN (with 1 M H2O) at −30 ºC (green solid line) and the solution after reaction with 10 mM DHA (black solid line). The latter spectrum exhibits the absorption features of (a) a (μ-oxo)diiron(III) decay product (λmax at 320, 350 and 490 nm) and (b) anthracene (λmax at 357 and 377 nm). For comparison, spectra for corresponding authentic compounds (FeIII–O–FeIII and anthracene) in MeCN (with 1 M H2O) at −30 ºC are also shown respectively in red and blue dotted lines. See Figure S1 for time-resolved spectral changes and the time trace at 620 nm together with its fit to a first-order kinetic model.

