
Fig. 2.
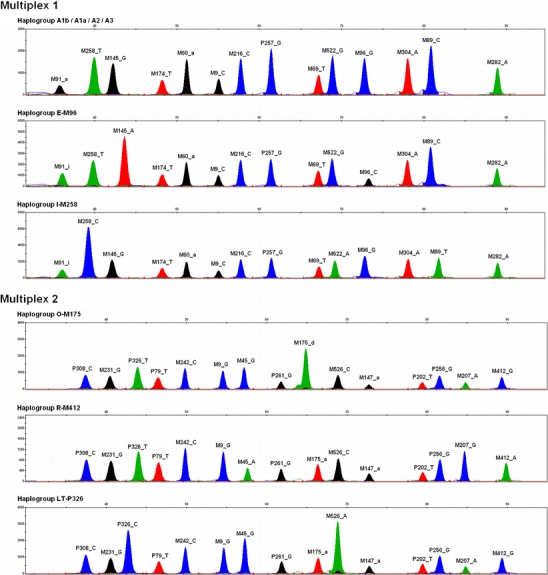
Typical electropherograms obtained with the two Y-SNP multiplex assays introduced here, using DNA samples belonging to a range of Y haplogroups. For each peak, the detected allele is indicated in concordance with Tables 1 and 2. As is convention, the yellow dye is shown as black for better contrast