
Figure 2. Deletion of RANKL in Osx1-Cre and Ocn-Cre expressing cells causes osteopetrosis.
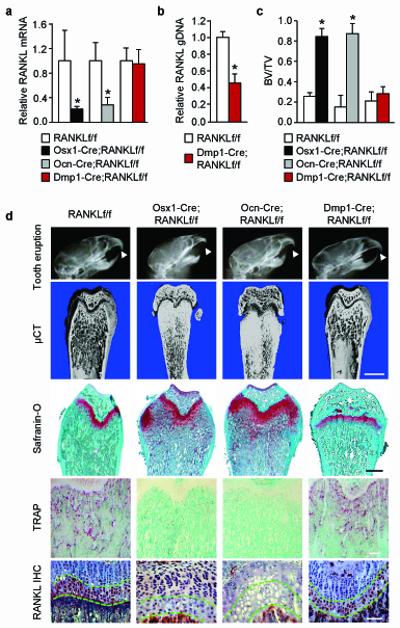
(a) RANKL mRNA levels in whole tibia of Osx1-Cre;RANKLf/f (n = 8), Ocn-Cre;RANKLf/f (n = 6), Dmp1-Cre;RANKLf/f (n = 9), and their respective RANKLf/f littermates (n = 4 to 11). *P < 0.05 versus RANKLf/f littermates, using Student’s t-test. (b) Quantitative PCR of loxP-flanked genomic DNA isolated from collagenase-digested femoral and tibial cortical bone of Dmp1-Cre;RANKLf/f (n = 9) mice and their RANKLf/f (n = 11) littermates. *P < 0.05 using Student’s t-test. (c) Cancellous bone volume of the distal femurs of Osx1-Cre;RANKLf/f (n = 8), Ocn-Cre;RANKLf/f (n = 6), Dmp1-Cre;RANKLf/f (n = 9), and their RANKLf/f littermates (n = 4 to 11). *P < 0.05 versus RANKLf/f littermates, using Student’s t-test. (d) X-ray images, representative μCT images of the distal femur (scale bar, 1 mm), safranin-O-stained histological sections of the distal femur (scale bar, 0.5 mm), anti-RANKL immunohistochemistry (IHC) (scale bar, 100 μm), and TRAP-stained histological sections of the distal femur (scale bar, 200 μm) from Osx1-Cre;RANKLf/f, Ocn-Cre;RANKLf/f, Dmp1-Cre;RANKLf/f, and a representative RANKLf/f littermate. Arrowheads in the X-rays indicate position of erupted incisors. μCT images for each of the RANKLf/f control littermates are presented in Supplementary Fig. 3. The region of the growth plate containing hypertrophic chondrocytes in the IHC images is outlined by green dashed lines and non-immune IgG controls are presented in Supplementary Fig. 3. All values and images are from 5-week-old mice and include both sexes.