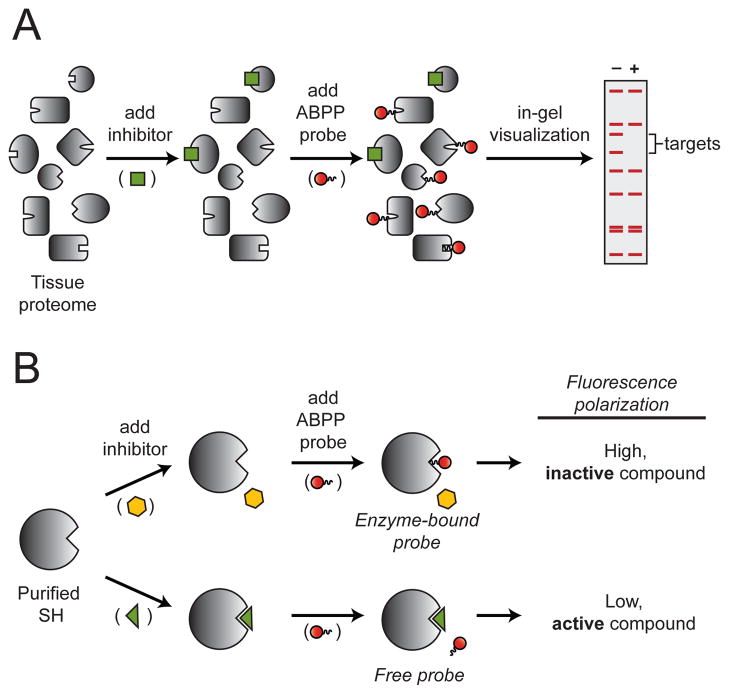
Fig. 32.
(A) Competitive ABPP. The potency and selectivity of a single inhibitor (green square) can be evaluated against SHs in a native tissue proteome by chasing the inhibitor with a SH-directed activity probe (red circle) and visualization by in-gel fluorescence following SDS-PAGE separation. Inhibitor targets are detected as bands with reduced fluorescence. (B) Fluopol-ABPP. A single SH can be evaluated against many compounds by chasing inhibitors (yellow hexagon or green triangle) with a SH-directed activity probe (red circle). Active (green triangle) or inactive (yellow hexagon) inhibitors will produce low or high fluorescence polarization signals, respectively.

