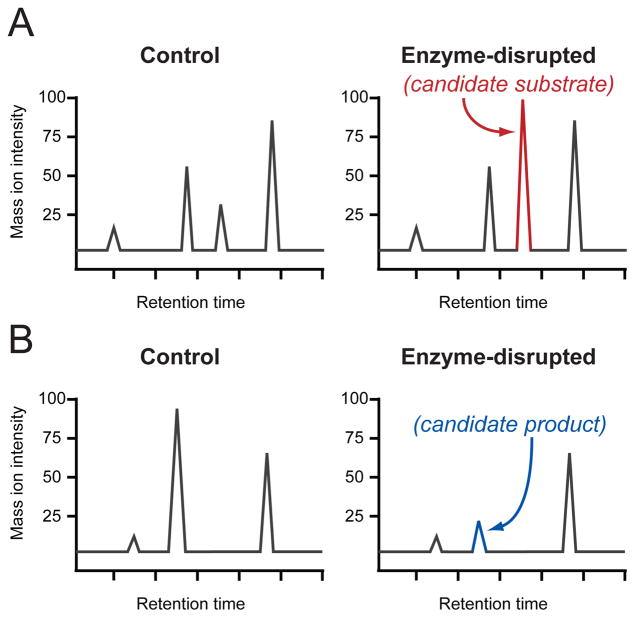
Fig. 34.
DMP can identify metabolite peaks in LC-MS analyses with relative levels that are either increasing (A) or decreasing (B) between control and enzyme-disrupted samples. The increasing or decreasing peaks correspond to candidate substrates and products, respectively. Standard-free, relative quantitation is achieved by comparison to the many other peaks that are not changing (shown in grey).

