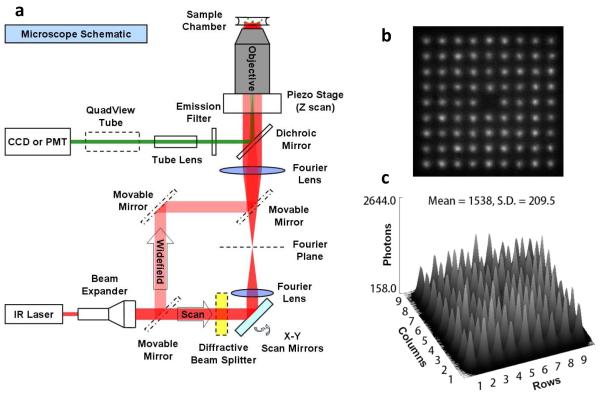
Figure 1.
Configuration of the 2P microscope. (a) Widefield and single, and multi-point scan. In the sample chamber a 3 × 3 matrix, instead of the actual 9 × 9 matrix is illustrated for clarity. The holograph splitter is conjugated via two 4f lenses to the back focal plane of the objective. (b) Image of excitation hologram matrix. Taken with 1 μM Qdot 605, laser at 785 nm. (c) 2D intensity plot of the hologram matrix in (b): SD = 13.6%.

