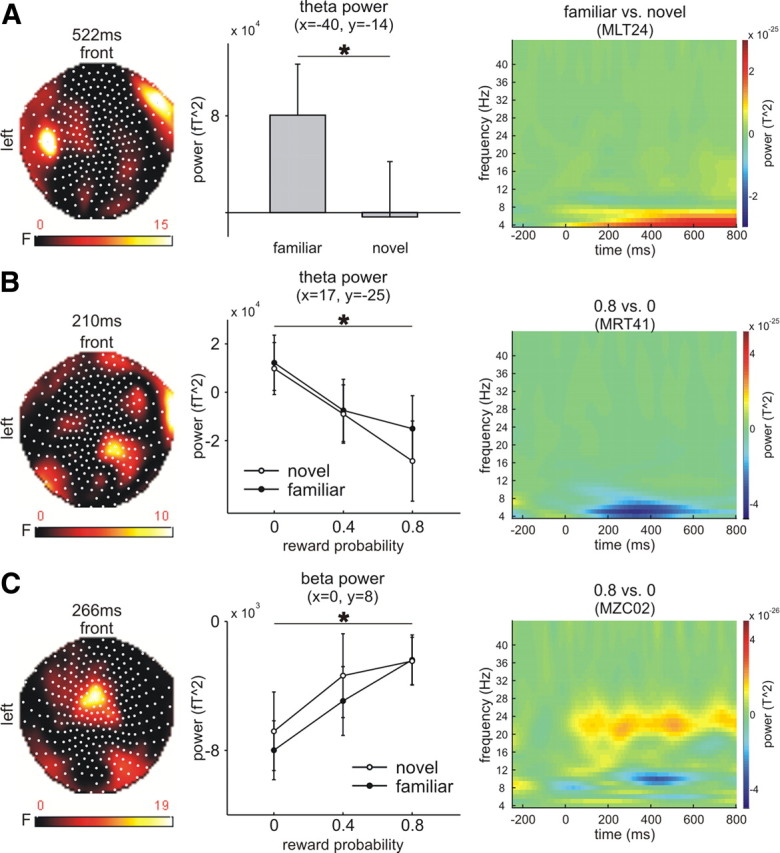
Figure 3.

Results of the time-frequency analyses. A, Theta power increased over right frontal and left temporal sensors (x = −40, y = −14; nearest channel: MLT24) for familiar stimuli with a peak at 522 ms. B, Theta power over right temporal and centroparietal sensors (x = 17, y = −25; nearest channel: MRT41) decreased as a function of reward probability. C, Beta power increased with reward probability over frontocentral sensors (x = 0, y = 8; nearest channel: MZC02). Left columns show statistical parametric maps of the F-statistics, middle columns show the effects for each condition at the peak time point as extracted from voxel space, and right columns show the time-frequency plots as extracted from the nearest channel (before conversion to voxel space; see Materials and Methods). Error bars denote 1 SEM (statistically significant differences, *p < 0.05).
