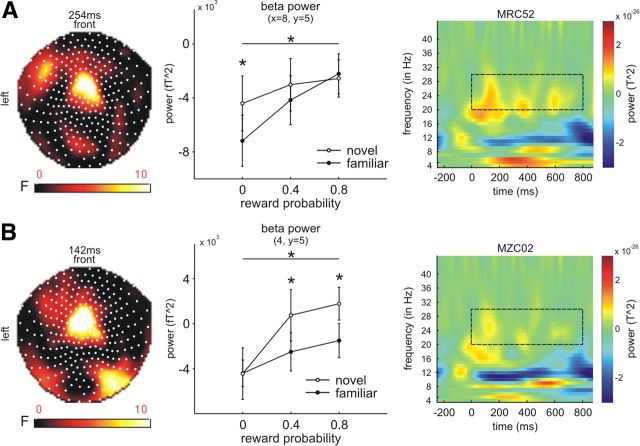
Figure 4.
Novelty bonus effects in the beta power. A, B, Over central sensors (A: x = 8, y = 5; nearest channel: MRC52; B: x = 4, y = 5; nearest channel: MZC02), beta power increased as a function of reward probability, and this effect was enhanced in the context of novelty for all reward probabilities (low, A; medium and high, B). Left columns show statistical parametric maps of the F-statistics, middle columns show the effects for each condition at the peak time point as extracted from voxel space, and right columns show the time-frequency plots as extracted from the nearest channel (before conversion to voxel space; see Materials and Methods). For A, right: p0 novel vs p0 familiar; for B, right: (p4 and p8) novel vs (p4 and p8) familiar. The dashed box indicates the beta frequency range (20–30 Hz) from 0 to 800 ms. It should be noted that the time-frequency data (right columns) were not rescaled by any logarithmic function (see Materials and Methods).

