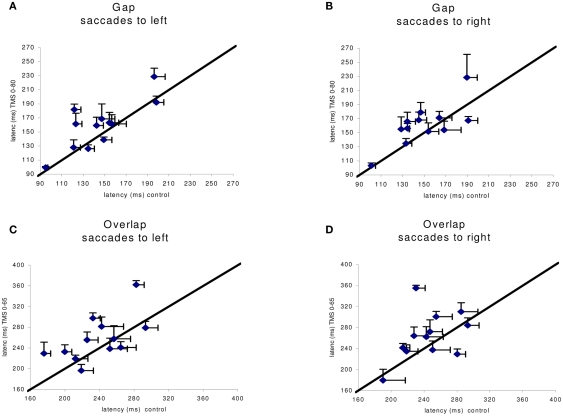
Figure A1.
Individual group means of latency in the control x axis) versus dTMS condition with corresponding SE (horizontal, vertical line segment, respectively). In (A,B) are shown data for the gap task in the control versus dTMS conditions, ISI 0–80 ms; in (C,D) are shown data from the overlap condition in the control versus dTMS condition, ISI 0–65 ms.

