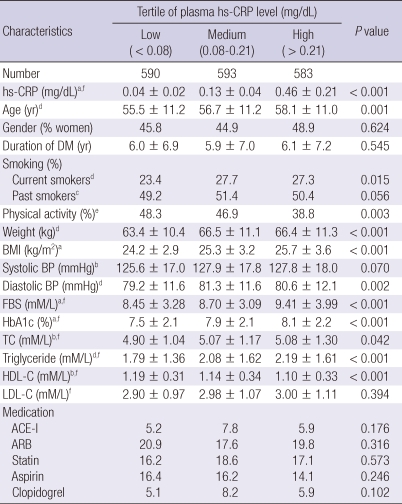
Table 1.
Baseline characteristics of the study population
Data are expressed as means ± SD and percentages. hs-CRP, C-reactive protein; DM, diabetes mellitus; BMI, body mass index; BP, blood pressure; FBS, fasting blood glucose; TC, total cholesterol; HDL-C, high-density lipoprotein-cholesterol; LDL-C, low-density lipoprotein-cholesterol; ACE-I, angiotensin converting enzyme-inhibitor; ARB, angiotensin receptor blocker. aP value among 3 groups < 0.05. bP value of low vs medium hs-CRP group < 0.05. cP value of low vs high hs-CRP group < 0.05. dP value of low vs medium and low vs high hs-CRP group < 0.05. eP value of low vs high and medium vs high hs-CRP group < 0.05. P value was estimated by a logistic regression analysis and a general lineal model after adjusting for age, sex, and duration of DM. fP was calculated from log-transformed data.

