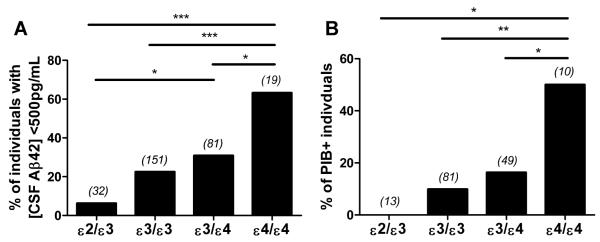
Fig. 1. Biomarkers of amyloid differ according to APOE genotype in cognitively normal individuals.
(A) Percentage of individuals (n=283) with [CSF Aβ42] < 500 pg/mL according to the following APOE genotypes: ε2/ε3, ε3/ε3, ε3/ε4, and ε4/ε4. Number in parentheses indicates number of individuals for each group. (B) Percentage of PIB+ individuals (n=153) according to APOE genotype: ε2/ε3, ε3/ε3, ε3/ε4, and ε4/ε4. Individuals with mean cortical binding potential for Pittsburgh compound B (MCBP) > 0.18 were considered PIB+. Number in parentheses indicates number of individuals for each group. χ2 analyses for proportions in (A) (χ2(3)=22.1785, P=5.99 × 10⁻⁵) and (B) (χ2(3)=14.4735, P=2.33 × 10⁻³) were performed; follow-up χ2 tests for pairwise comparisons of proportions were performed using Benjamini and Hochberg’s linear step-up adjustment to control for type I error. *P<0.05,**P<0.01,***P<0.001.

