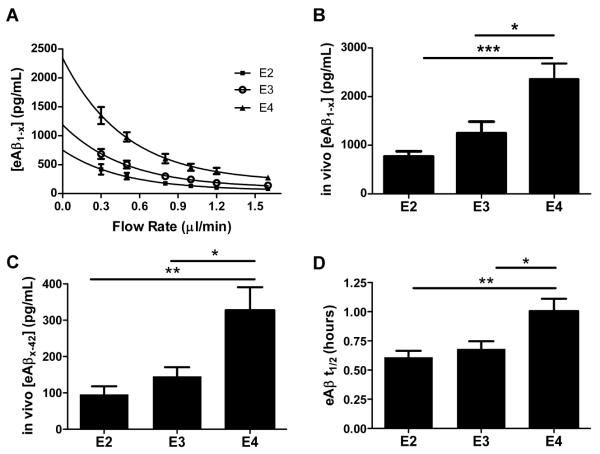
Fig. 4. ApoE isoform-dependent differences in soluble Aβ concentration and clearance exist prior to the onset of Aβ deposition.
(A) An exponential decay regression was used to fit the concentrations of eAβ1-x measured by ELISA at each flow rate for individual mice from groups of young, sex-matched PDAPP/TRE mice (n=6 mice per group; 3 to 4 months old). The equations from the individual regressions were used to calculate [eAβ1-x] at x=0 for each mouse, representing the in vivo concentration of eAβ1-x recoverable by microdialysis. (B) Mean in vivo concentrations of eAβ1-x (pg/mL) calculated from the method in (A). (C) Mean concentrations of Aβx-42 (pg/mL) collected from the hippocampal ISF of young, sex-matched PDAPP/TRE mice using a flow rate of 0.3μl/min (n=8 mice per group; 3-4 months old). (D) eAβ t1/2 from clearance experiments in young, sex-matched PDAPP/TRE mice after stable baseline measurement of eAβ1-x (n=10 to 11 mice per group; 3 to 4 months old). When one-way ANOVA was significant, differences among groups were assessed using Tukey’s post hoc test for multiple comparisons *P<0.05, **P<0.01, ***P<0.001. Values represent means ± SEM.

