
Fig. 3.
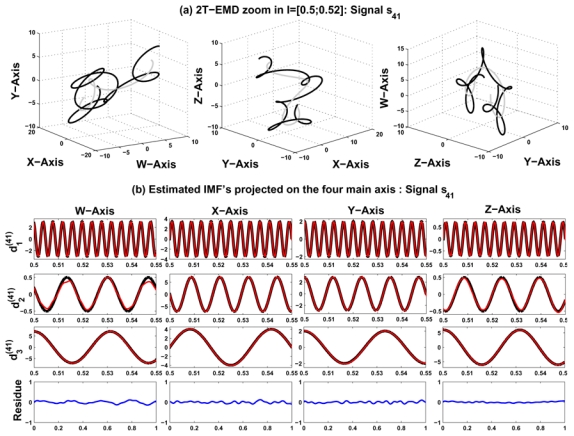
2T-EMD quadrivariate decomposition of the signal s41: (a) original signal (dark) and its 2T-EMD local mean (gray), and (b) exact (dashed line) and estimated (plain line) IMFs projected on the four main axis W, X, Y and Z.
Official websites use .gov
A
.gov website belongs to an official
government organization in the United States.
Secure .gov websites use HTTPS
A lock (
) or https:// means you've safely
connected to the .gov website. Share sensitive
information only on official, secure websites.
2T-EMD quadrivariate decomposition of the signal s41: (a) original signal (dark) and its 2T-EMD local mean (gray), and (b) exact (dashed line) and estimated (plain line) IMFs projected on the four main axis W, X, Y and Z.