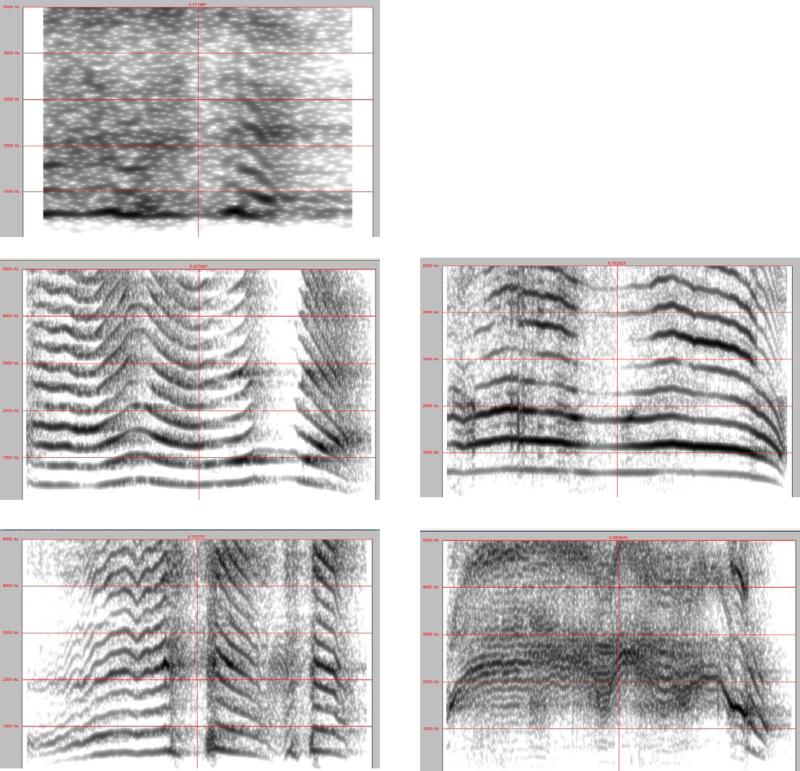
Figure 1.
Sample spectrograms of fuss, whine, and cry, (left column, reading down) and yell and scream (right column, reading down). Duration is on the X axis (and varies by type of sound) and frequency is on the Y-axis (from 0 to 5000 Hz with grid lines every 1000 Hz). Darkness of lines indicated more energy in that frequency range. See text for description of acoustic characteristics of each type of vocalization.

