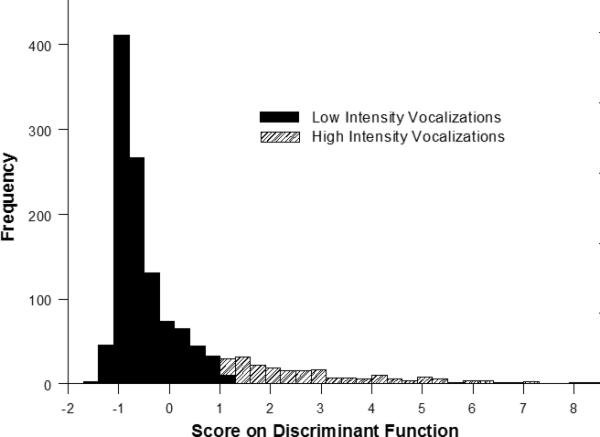
Figure 2.

Distribution of scores for low intensity (fuss and whine) and high intensity sounds (cry, yell, and scream) on the discriminant function. Note that there is almost no overlap in scores, and the classification accuracy is 93%. See text for a description of the variables loading on the discriminant function.
