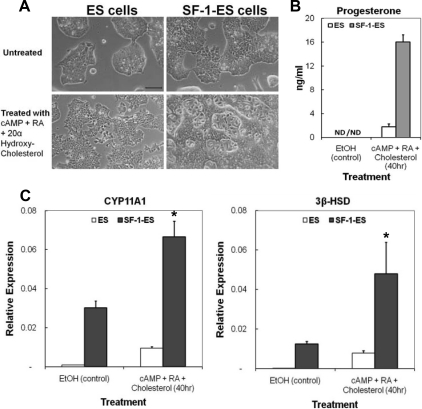
Fig. 1.
Characterization of SF-1-ES cells. A, Morphological changes seen in the ES cells after stable transfection with SF-1 to produce SF-1-ES cells and after treatment for steroidogenic induction. B, Progesterone production by ES cells and SF-1-ES cells after induction of steroidogenesis for 40 h. The results represent averages of three or more independent experiments performed at least in triplicate. Similar results were obtained when these experiments were repeated with three different SF-1-ES cell clones. C, Real-time RT-PCR of CYP11A1 and 3β-HSD mRNAs. Relative mRNA expression levels were calibrated to 18S RNA. Values are means ± sd (n = 3). *, P ≤ 0.05. ND, Not detectable.

