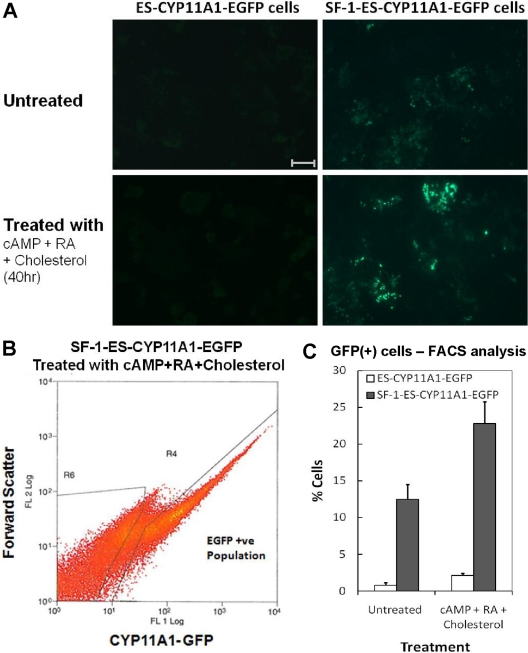
Fig. 2.
Quantitation of SF-1-ES cells expressing CYP11A1. A, EGFP fluorescence reflects CYP11A1 promoter activity in SF-1-ES cells before and after treatment with cAMP, RA, and cholesterol. B, FACS sorting of SF-1-ES-CYP11A1-EGFP (+) cells after treatment with cAMP, RA, and cholesterol. C, Quantitation of FACS analysis of SF-1-ES-CYP11A1-EGFP (+) cells. Bar, 100 μm.

