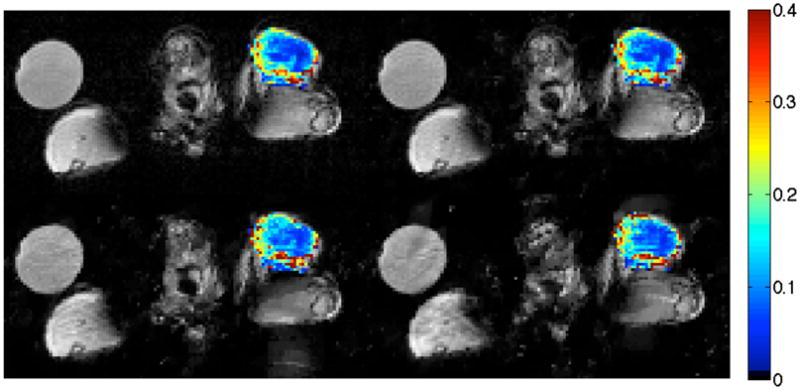
Figure 1.

Example of reconstructed tumor Ktrans maps for one mouse data set. Images are an axial view of the fully sampled data (upper left), 2× CS (upper right), 3× CS (lower left), and 4× CS (lower right). The color overlay is the Ktrans value at each voxel in the tumor. This hind-leg tumor displays a well-perfused rim surrounding a more centrally located necrotic region, a feature well reproduced in both CS reconstructions. The circular object at upper left is a water vial.
