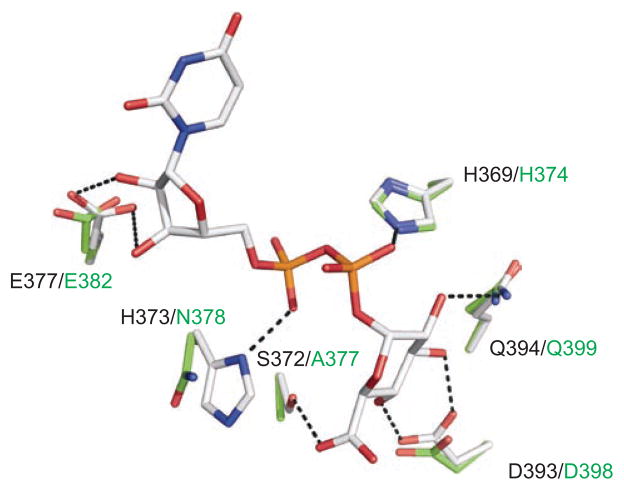
Figure 7.
A ball-and-stick model representation of the UDP-GlcUA binding site in UGT1A10 (carbon, gray) and UGT2B7 (carbon, green). The bound co-substrate and the location of key residues within hydrogen bonding distance in either UGT1A10 or UGT2B7. In both models: nitrogen, blue; oxygen, red; phosphate, orange. Dashed black lines represent possible hydrogen bonds. The residue types and numbering are indicated for both UGT1A10 (black) and UGT2B7 (green). Model produced in PyMOL (http://www.pymol.org). Reprinted from Xiong et al. (2008) with permission from ASPET.

