
Figure 2.
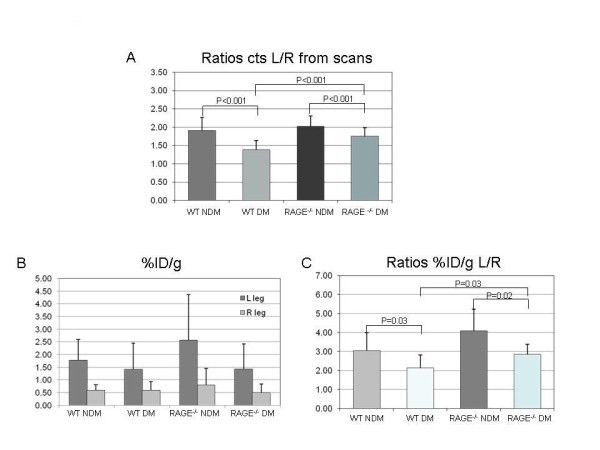
Data from scans and ex vivo well counting for both hindlimbs. (A) Bars represent mean ± standard deviation values for the ratios of left/right (L/R) hindlimbs from the scan count data. (B) Bars represent mean ± standard deviation values for %ID/g for both the left and right legs. (C) Bars in graph represent mean ± standard deviation values for the ratios for %ID/g for L/R hindlimbs. WT, wild-type; DM, diabetes mellitus; NDM, non-diabetes mellitus.