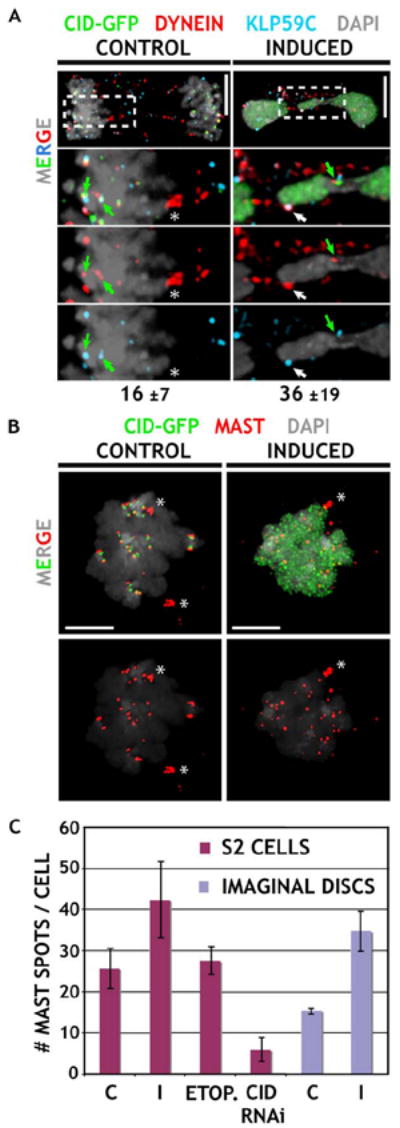
Figure 7. Distributions of Microtubule Motors and the Plus-End Binding Protein MAST Suggest the Presence of Functional Ectopic Kinetochores.

(A) Localization of the motor proteins Dynein and kinesin KLP59C. Merged images for anaphase figures are shown on top, and enlargements are shown below. CID-GFP-expressing cells were stained for CID (green), Dynein, and KLP59C (blue). Control cells display close association of both proteins only at endogenous centromeres (green arrows), whereas they frequently colocalize at ectopic chromosomal sites (white arrow) after induction (average number of sites indicated below, see Table S1). Note that Dynein also decorates underlying spindle microtubules (asterisk). The scale bars are 5 μm.
(B) Localization of the microtubule plus-end binding protein MAST. Metaphase figures from induced cells contain more MAST (red) spots than observed in controls. The scale bars are 5 μm.
(C) Quantitation of MAST spots in S2 and imaginal disc cells. MAST signals associated with spindle poles (asterisk in [B]) were not included in the quantitation. Induced cells contained significantly elevated numbers of MAST spots compared to controls (p values in text). Etoposide treatment did not alter the number of MAST spots from control values, and CID depletion by RNAi resulted in significantly fewer MAST spots than controls (p < 0.001 for I or CID RNAi versus C; S2 cells: nC = 19, nI = 17, nETOP = 16, nCID RNAi = 14, imaginal disks: nC = 12, nI = 13). Error bars are ±1 standard deviation from the average.
