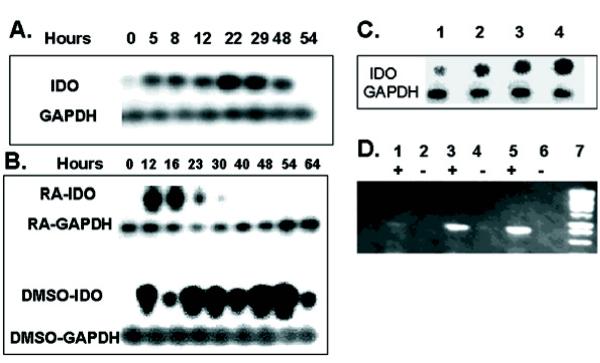
Figure 4.
IDO expression in RAW and P19 cells in vitro. (A) RAW cells were harvested by scraping and 1 × 10⁶ cells were seeded into 5 ml culture dishes. Cultures were harvested at various time points and assayed for IDO expression by RT-PCR. (B) P19 cells were aggregated in suspension cultures in the presence of either 1% DMSO or 10-6 M RA. Cultures were harvested at various time points and assayed for IDO expression by RT-PCR. (C) Effect of EGTA on expression of IDO 24 hours following seeding of P19 aggregates. P19 cells were seeded into suspension cultures in the presence of 5 mM (lane 1), 3 mM(lane 2), 1 mM (lane 3) or no EGTA (lane 4). (D) IDO antisense expression. RT-PCR products electrophoresed on 0.8% agarose. Lanes; 1&2: antisense clone C2, 3&4: antisense clone D3, 5&6: antisense clone E6, 7: molecular weight marker. Lanes marked with + or -; reverse transcriptase present or absent respectively.

