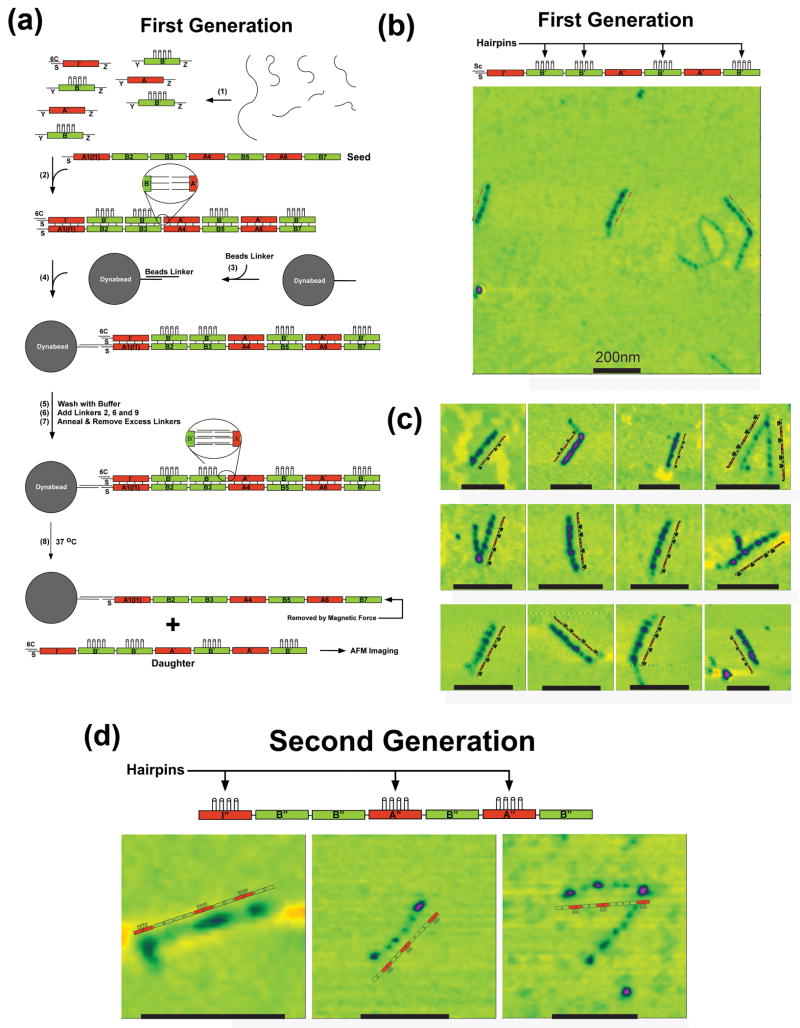
Figure 3. DNA generations.
(a) Replication of the Seed Pattern in the First Generation. Strands are annealed in step 1, where the tiles are all flanked by the same connectors, designated Y and Z. The initiator tile contains a protected S-strand, paired with a cover strand, 6C. The B′ tiles contain the 4-hairpin markers for AFM imaging. In the presence of the seed tile (step 2), the strands assemble into a pattern mimicking the seed pattern. The magnetic dynabead is prepared in step 3, and attached to the seed (step 4). This is followed by a wash step, the addition of linkers and their annealing (steps 5-7). Heating the system to 37 °C results in the separation of the daughter 7-tile complex and the seed (removed magnetically). (b) Atomic Force Microscopy of First Generation Constructs Showing a Typical Field Slightly Larger than a Square Micron. Black scale bars correspond to 200nm. (c) Zoomed Images of Heptameric Daughter Complexes. These images, flanked by explanatory schematic images demonstrate that the ABBABAB pattern has been replicated successfully. (d) AFM Images of Second Generation Molecules. These zoomed images show the pattern that was programmed in the original seed tile.

