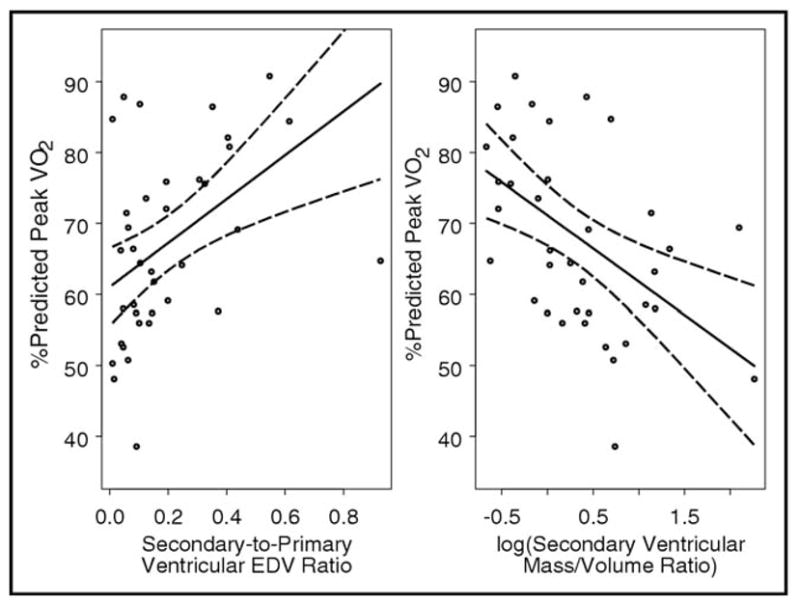
Figure 1.

Relation between percentage of predicted peak oxygen consumption and (A) secondary/primary end-diastolic volume ratio (n = 38; R = 0.49; p = 0.002) and (B) log-transformed secondary chamber mass/volume ratio (n = 37; R = −0.58; p = 0.002). Both graphs show linear regression fits with 95% point-wise confidence bands and were restricted to subjects who achieved maximal aerobic capacity (respiratory exchange ratio ≥1.1).
