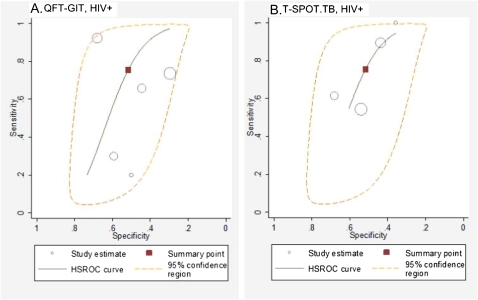
Figure 3.
A and B, Hierarchical summary receiver operating characteristic (HSROC) plot of studies that reported both sensitivity and specificity among persons with suspected active tuberculosis. The summary curves from the HSROC model contain a summary operating point (red square) representing summarized sensitivity and specificity point estimates for individual study estimates (open circles). The 95% confidence region is delineated by the area in the orange dashed line.

