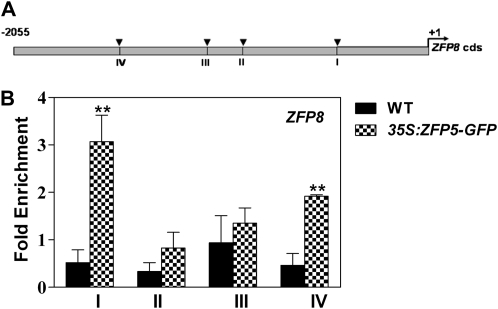
Figure 10.
ChIP analysis of ZFP8 promoter regions bound by 35S:ZFP5-GFP. A, Schematic diagram of the ZFP8 promoter. The arrowheads indicate the sites containing either a single mismatch or a perfect match from the consensus binding sequence A[AG/CT]CNAC for C2H2 zinc finger proteins. B, Quantitative real-time PCR assay of DNAs after ChIP. TUBULIN2 was used as a reference, and the primer used was described by Yu et al. (2010). Values are averages, and error bars correspond to se. lsd values were calculated at the probability of 1% (** P < 0.01). WT, Wild type.

