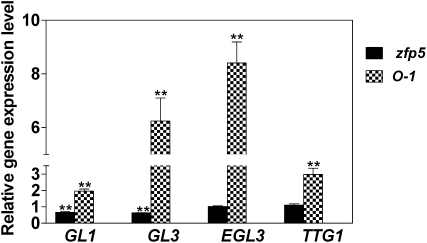
Figure 6.
Relative expression of GL1, GL3, EGL3, and TTG1 in developing inflorescence shoots of zfp5 and 35S:ZFP5. Values represent the ratios of gene expression in a particular genotype to the corresponding wild type or transgenic control. O-1, 35S:ZFP5-overexpressing line 1. lsd values were calculated at the probability of 1% (** P < 0.01).

