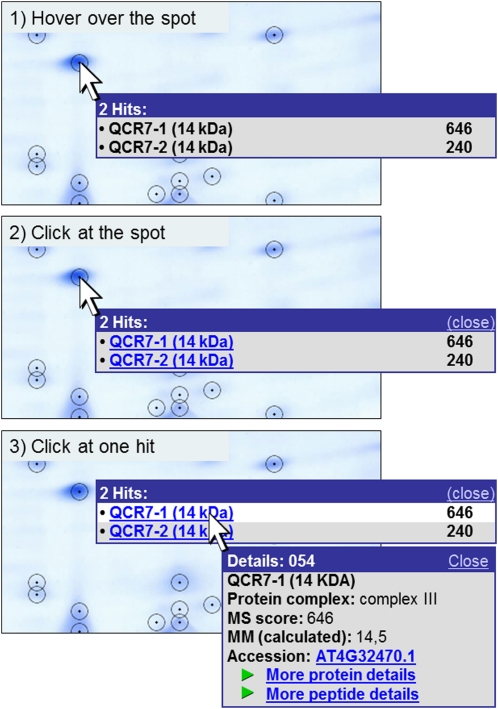
Figure 4.
Pop-up function on the gel map. Information about the proteins identified in a spot can be viewed directly on the gel image. The user can hover over a spot (1) that opens a tooltip containing the names of all included proteins (left) as well as their MS reliability scores (right). By clicking on the spot (2), the window is fixed, and protein names are hyperlinked to more detailed information. Protein details become visible in a new window by clicking on the protein of interest (3). If only one protein is identified in a spot, the first click on the spot already opens the details window shown in 3. This window contains (from top to bottom): spot number (in the blue frame), protein name, dedicated protein complex, MS reliability score, the calculated molecular mass, and the Accession number (according to TAIR), which is linked to the respective entry on the TAIR homepage (www.arabidopsis.org). The “more protein details” link at the bottom of the details window is linked to a table showing all proteins identified in the respective spot (Supplemental Table S1). Besides the characteristics already given in the pop-up window, it contains further information about spot characteristics (such as coordinates and apparent masses), MS analysis, and the physiological context of the proteins (Table I). The “more peptide details” link leads to a table that includes details of the peptides identified by MS.

