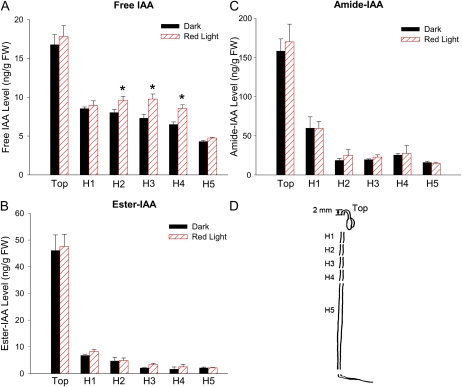
Figure 7.
Light increased the level of free IAA in specific regions of etiolated tomato hypocotyls. Tissue sections that displayed a significant change in IAA level after 100 μmol m−2 R light exposure followed by 1 d of darkness are indicated by asterisks (P < 0.05, n = 4, Student’s t test). A, Level of free IAA in etiolated tomato tissue sections with or without R light exposure. FW, Fresh weight. B, Level of ester-linked IAA (determined following a 1-h 1 n NaOH hydrolysis at room temperature and then subtracting the level of free IAA) in etiolated tomato tissue sections with or without R light exposure. No significant change in response to R light was found in any tissue sections. C, Level of amide-linked IAA (determined following a 3-h 7 n NaOH hydrolysis at 100°C and then subtracting the level of free + ester IAA) in etiolated tomato tissue sections with or without R light exposure. No significant change in response to R light was found in any tissue section. D, Tissue sections analyzed in A to C. Top, Meristem, cotyledons, and the hook region; H1 to H4, 6-mm hypocotyl sections adjacent to each other; H5, the remaining hypocotyl below H4. [See online article for color version of this figure.]

