Figure 8.
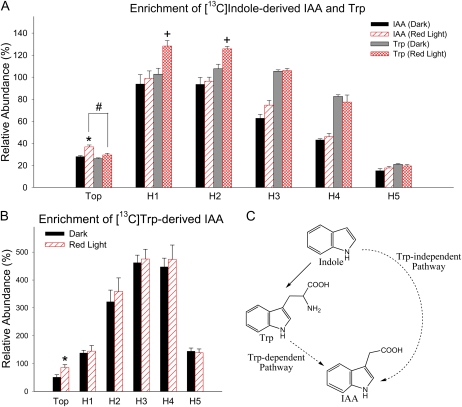
Light increased the biosynthesis of IAA from labeled precursors in the top section of etiolated tomato seedlings. Tissue sections that show significant change in IAA biosynthesis after 100 μmol m−2 R light exposure followed by 1 d of darkness are indicated by asterisks (P < 0.05, n = 4, Student’s t test). Relative abundance is defined as the ratio of the ion abundance ([m/z 131]/[m/z 130] × 100) corrected for the natural abundance of 13C in the unlabeled IAA. A, Relative enrichment of the unlabeled pools by labeled IAA and Trp synthesized from [13C]indole during a 4-h feeding period. The enrichment of label in Trp in H1 and H2 was significantly increased after R light exposure (+; P < 0.05, n = 4, Student’s t test). In the top section after R light exposure, the enrichment of label in IAA was significantly higher than that of Trp (#; P < 0.05, n = 4, Student’s t test). B, Enrichment of labeled IAA from that synthesized from [13C]Trp during a 4-h feeding period. C, A simplified summary of IAA biosynthetic pathways. The solid arrow represents a single-step process; dashed arrows indicate multiple steps; thus, the pathways are shown in abbreviated form. [See online article for color version of this figure.]

