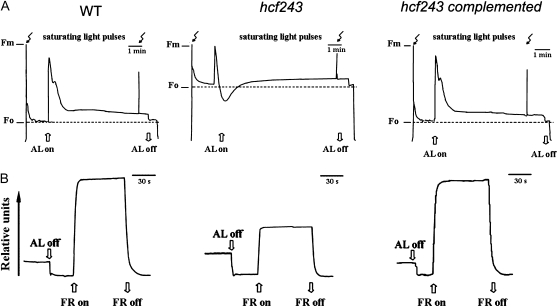
Figure 2.
Spectroscopic analysis of wild-type (WT), hcf243, and hcf243 complemented plants. A, Chlorophyll fluorescence induction. The minimum fluorescence yield (F0) of dark-adapted plants was measured using a pulsed measuring beam of red light. The maximum fluorescence yield (Fm) was determined after a saturating pulse of white light in dark-adapted leaves. B, P700 redox kinetics. The redox kinetics were investigated by measuring absorbance changes of P700 at 820 nm induced by far-red light (FR; 720 nm). AL, Actinic light (120 μmol m−2 s−1).

