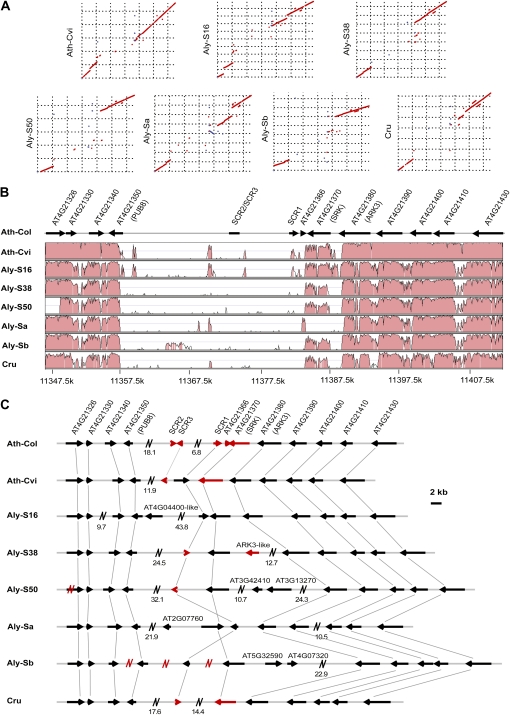
Figure 1.
Comparison of S-locus haplotypes. A, Dot plot highlighting sequence similarity and rearrangement between each S-locus haplotype and Ath-Col. B, A VISTA plot indicating similarity between Ath-Col and the other S-locus haplotypes. C, A comparison of gene content among different S-locus haplotypes. Red arrows indicate the SRK-, SCR-, and ARK3-related truncated sequences. Red N symbols represent gaps, and black N symbols represent large fragments not drawn to scale (actual length in kb is given below). [See online article for color version of this figure.]

