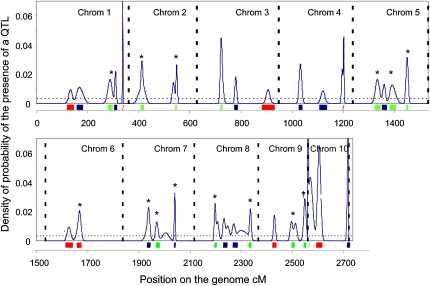
Figure 3.
Overview of meta-QTLs affecting the response of leaf growth to water deficit or evaporative demand. Blue curves show the density of probability of the presence of a QTL in the considered interval of 0.5 cM. The dotted horizontal line is the threshold defined as five times the average value for the uniform probability. Meta-QTLs are projected on the consensus map as thick bars: red, meta-QTL for sensitivity to soil water deficit; blue, meta-QTL for sensitivity to evaporative demand; green, meta-QTL for both sensitivities. Meta-QTLs annotated with asterisks are the most promising because they harbored QTLs with high LOD scores and/or were detected in at least two mapping populations or for two sensitivities in a population.

