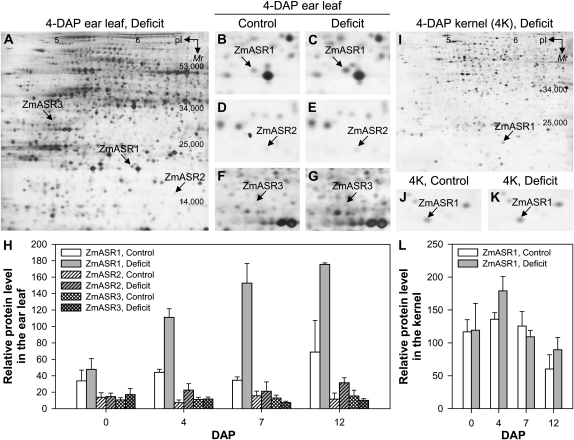
Figure 3.
Expression profile of ZmASR1, ZmASR2, and ZmASR3 proteins in ear leaf and kernel tissues. 2-DE gels of ZmASR1, ZmASR2, and ZmASR3 proteins extracted from 0-, 4-, 7-, and 12-DAP ear leaf (150 μg of protein per strip) or kernel (30 μg of protein per strip) of MBS847 plants daily irrigated (control) or subjected to water deprivation (deficit) 7 d before pollination are shown. A to G, 2-DE gel images of 4-DAP ear leaf in well-watered (B, D, and F) and water deficit (A, C, E, and G) conditions with the identified ZmASR1, ZmASR2, and ZmASR3 isoforms. H, Quantification of ZmASR1, ZmASR2, and ZmASR3 isoforms in the ear leaf. I to K, 2-DE gel images of 4-DAP kernel (4K) in well-watered (J) and water deficit (I and K) conditions with the identified ZmASR1 isoform. L, Quantification of the ZmASR1 isoform in the kernel. Values represent means of three biological replicates ± se.

