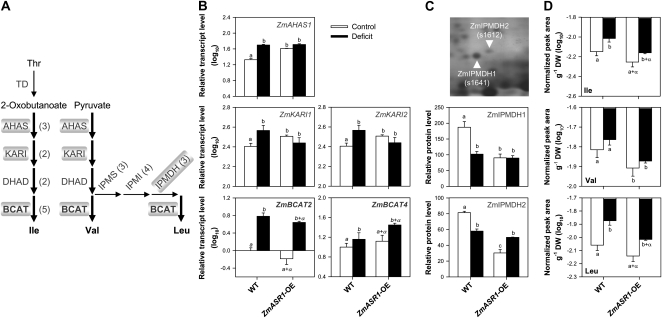
Figure 6.
ZmASR1-OE influences BCAA-related gene expression and BCAA composition. A, The BCAA biosynthetic pathway. Substrates and products are in lightface and boldface text, respectively. Enzymes are in gray, and the number of isoforms identified in maize is indicated in parentheses. The enzymes in boldface are the rate-limiting enzymes during the water deficit response. Thick arrows indicate common steps in BCAA biosynthesis. Enzymes in boxes are ZmASR1 targets. B to D, Relative transcript (B), protein (C), and metabolite (D) levels in the 11th leaves of wild-type (WT) and ZmASR1-OE plants according to Figure 5, Table I, and Table II. Values represent means of biological duplicates ± se. When two samples show different letters above the bar, the difference between them is significant (roman letters, P < 0.05; italic letters, P < 0.10). When both genotype and treatment effects are significant, a, b, a+α, and b+α are indicated (see “Materials and Methods”). AHAS, Acetohydroxyacid synthase; DHAD, dihydroxyacid dehydratase; DW, dry weight; IPMI, isopropylmalate isomerase; IPMS, isopropylmalate synthase; TD, Thr deaminase.

