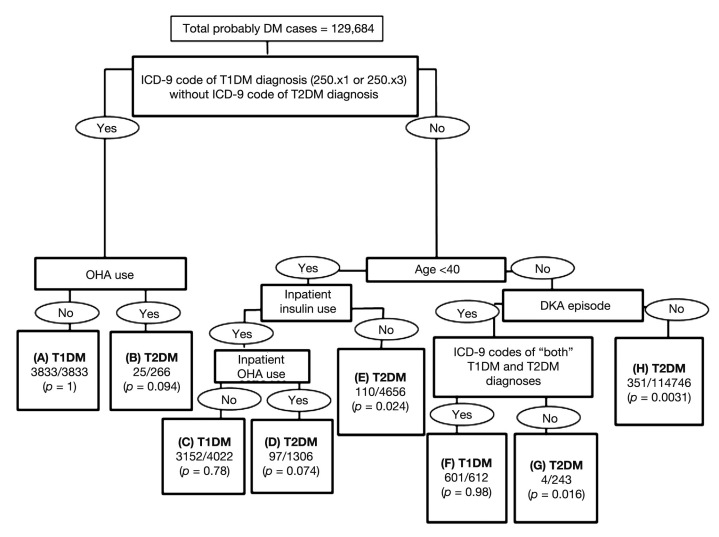
Figure 1.
A tree-based model for predicting T1DM and T2DM cases. In each terminal node, the first line represents the predicted category (T1DM or T2DM) and the second line represents the empirical probability of being a T1DM case (i.e., the number of probable T1DM cases divided by total number in that terminal node). The distance between the splits represents the relative importance of the splits. For example, the most important indicator defines the first split.

