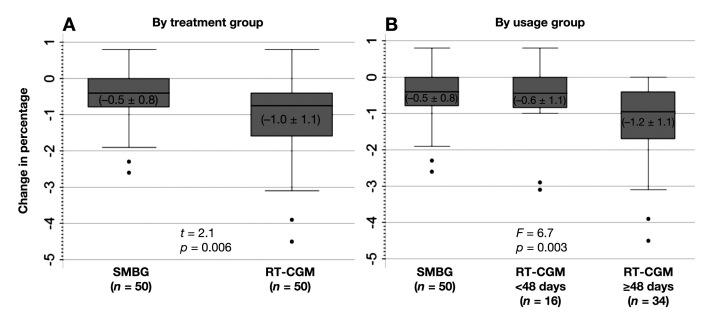
Figure 2.
Changes in A1C from baseline to 12 weeks, (A) by treatment group and (B) by RT-CGM usage group. The figure shows boxplots. The boxes themselves contain the 25th, 50th, and 75th percentiles. The whiskers of the boxes show the minimum and maximum values, with the dots beneath the whiskers indicating possible outlying values. Means ± SDs are shown in parentheses within each box. P values are from t-tests or ANOVA comparing the group's mean changes. In multiple regression analyses in which change scores for each outcome were regressed on age, gender, therapy, baseline value for the outcome, and treatment group, group was a significant predictor of change in A1C, -0.48 meaning the RT-CGM group had an adjusted decline in A1C of 0.48% greater than the SMBG group (p = .006). For the RT-CGM group ≥ 48 days, adjusted decline in A1C was -0.60 (p = .002) relative to the SMBG group. Group was not significant for the other outcomes, weight, and BP.

