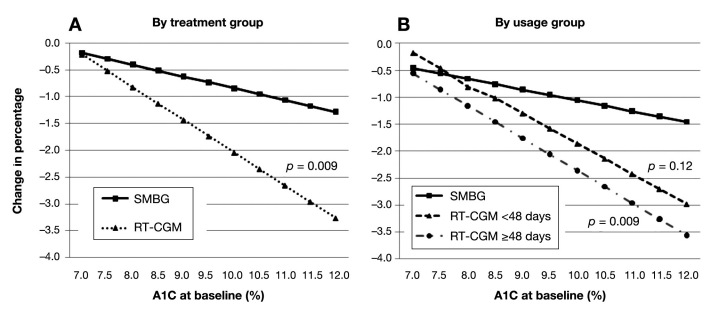
Figure 3.
Interaction of baseline A1C with group in the prediction of 12-week change in A1C. Figures were derived from multiple regression analyses. P values for interaction effects are shown in parentheses in the graphs and refer to the difference from the SMBG group. The coefficient (standard error) for the A interaction term, group × baseline A1C, was -0.39 (0.14). The coefficient (standard error) for the B interaction terms, (RT-CGM < 48 days) × (A1C at baseline) and (RT-CGM ≥ 48 days) × (A1C at baseline), were -0.36 (0.23) and -0.40 (0.15), respectively. Equations for the plotting of the lines assumed mean age, male gender, and oral medications only.

