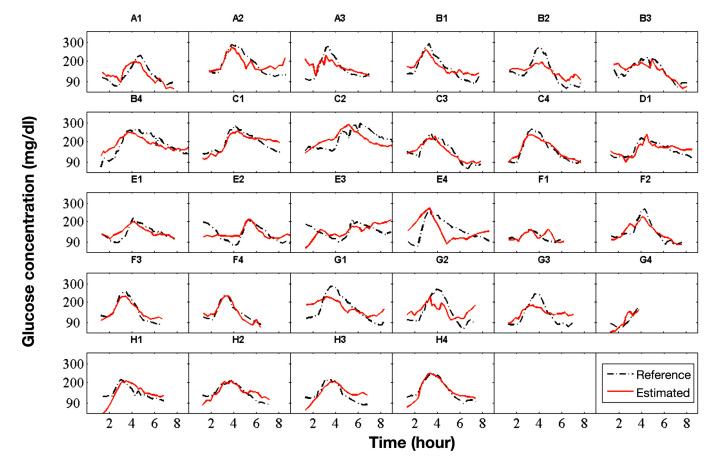
Figure 2.
Plots with results of all runs (study visits). Time series of the invasively measured BGL (dashed line) and the estimation of the BGL (solid line) of the global model. Letters were used to identify the different patients (A, B, …) and numbers to count the runs (study visits) of patients (A1, A2, …). The time is given in hours from the start of the run.

